

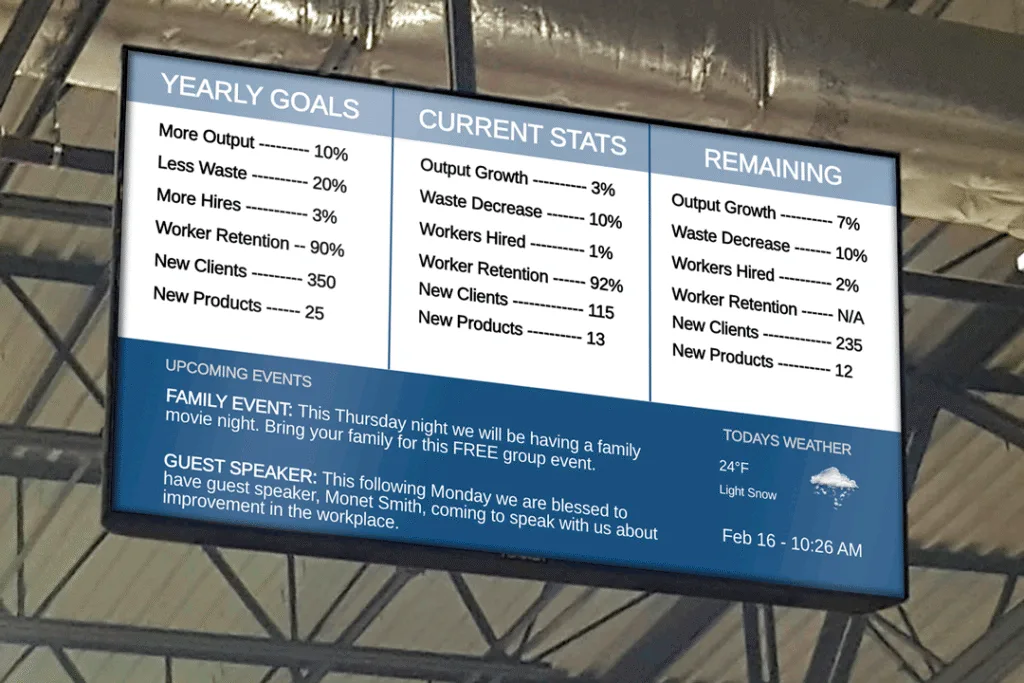
Your data tells a story, but that story is lost if it’s hidden in a spreadsheet or locked behind a login screen that no one checks. Digital signage bridges this gap, turning static screens into dynamic dashboards that drive performance and transparency.

By integrating Microsoft Power BI with Arreya’s digital signage software, you can broadcast real-time metrics—from manufacturing KPIs to sales goals—directly to the teams that need them most.
What is Power BI Embedding in Digital Signage?
Power BI embedding is the process of taking a live, interactive data report created in Microsoft’s Power BI service and displaying it within your digital signage content via a URL or iframe. This allows you to visualize complex data streams (like production quotas, patient wait times, or revenue tracking) on shared screens without requiring manual updates.
Step 1: Generate Your Power BI Embed URL
Before opening your Arreya Creative Studio, you must first prepare your report in the Power BI Service. There are two primary ways to do this, and choosing the right one depends entirely on your data security needs.
Option A: Publish to Web (Public)
Best for: Non-sensitive data, lobby displays, cafeteria menus, and general announcements.
This method creates a public link. It is the easiest to set up but should not be used for confidential data as anyone with the link can theoretically view the report.
- Open your report in the Power BI Service.
- Navigate to File > Embed report > Publish to web (public).
- Review the warning dialog (ensure your admin has enabled this feature).
- Copy the URL provided in the “Link you can send in email” field.
Option B: Embed in Website or Portal (Secure)
Best for: Internal KPIs, financial data, patient information, and proprietary metrics.
This method requires user authentication. The digital signage player (the device attached to your screen) will need to be logged into a valid Power BI account to display the content.
Note: Using this method requires the device playing the content to authenticate via Azure Active Directory. You may need to connect a mouse/keyboard to your player device to log in once.
Open your report in the Power BI Service.
Navigate to File > Embed report > Website or portal.
Copy the URL provided in the “Link you can use to embed content” field.
Step 2: Add the Power BI Widget in Arreya
Once you have your URL, adding it to your display is a matter of copy-and-paste. Arreya’s cloud-based CMS makes this seamless via the Website Widget.
1. Access the Creative Studio Log in to your Arreya account and select the Presentation you wish to edit.
2. Select the Website Widget In the editor toolbar, click the Widgets dropdown menu and select Website.
3. Configure the Widget
- Widget Format: Ensure URL is selected.
- Paste URL: Paste the Power BI link you generated in Step 1 into the empty field.
- Finish: Click “OK” or “Add” to place the widget on your canvas.
4. Position and Resize Drag the widget to your desired location. You can make it full-screen for a dedicated dashboard or place it in a zone alongside other content like weather or news tickers.
5. Push Live Click the Push Live button. Your screens will update instantly to show the live report.
Pro Tip: If you are using “Option B (Secure),” ensure your playback devices (Chromebox, Shield, etc.) are authorized users. You may need to log in to Microsoft on the device browser before the content will appear.
3 Tips for Designing Dashboards for Digital Signage
A report designed for a desktop monitor doesn’t always translate well to a TV on a wall. Follow these rules to ensure readability:
- Increase Font Sizes: Standard 12pt font is invisible on a wall-mounted display. Aim for 24pt+ for data labels and 60pt+ for key metrics.
- High Contrast: Use dark backgrounds with bright text (white, yellow, cyan) to reduce eye strain and improve visibility from a distance.
- Simplify the View: Don’t embed a report with 10 different tabs. Create a specific “Signage View” in Power BI that highlights only the top 3-4 most critical metrics.
Frequently Asked Questions
Does the dashboard update in real-time?
Yes and no. The data updates based on your Power BI dataset refresh settings. However, the visual on the screen may cache. You can set the Arreya page to reload periodically, or use a browser extension on the player to force a refresh, ensuring the latest data is always visible.
Is my data secure?
If you use Option B (Website or Portal), your data retains all Microsoft security protocols, including Row-Level Security (RLS). Access is restricted to authorized users (the account logged into the player). If you use Option A (Publish to Web), the data is public.
Can I interact with the report on a touchscreen?
Yes! Arreya supports full interactivity. If you are using a touchscreen display, users can tap visuals, filter data, and switch tabs on the Power BI report just as they would on a tablet.

Ready to Visualize Your Success?
Don’t let your data gather dust. With Arreya and Power BI, you can create a transparent, high-performance culture by putting the right numbers in front of the right people.
Need help setting up your first dashboard? If you’re an Arreya Care subscriber, our US-based support team can walk you through the integration step-by-step.
[Contact Support] | [Start a Free Trial]